graphviz是贝尔实验室开发的一个开源的工具包,它使用一个特定的DSL(领域特定语言): dot作为脚本语言,然后使用布局引擎来解析此脚本,并完成自动布局。graphviz提供丰富的导出格式,如常用的图片格式,SVG,PDF格式等。
用graphviz来绘图的时候,你的主要工作就是编写dot脚本,你只要关注图中各个点之间的关系就好了,你不需要考虑如何安排各个节点的位置,怎样布局能够使你所绘制的图看起来更美观一些。
graphviz中包含了众多的布局器:
- dot 默认布局方式,主要用于有向图
- neato 基于spring-model(又称force-based)算法
- twopi 径向布局
- circo 圆环布局
- fdp 用于无向图
首先,在dot脚本中定义图的顶点和边,顶点和边都具有各自的属性,比如形状,颜色,填充模式,字体,样式等。然后使用合适的布局算法进行布局。布局算法除了绘制各个顶点和边之外,需要尽可能的将顶点均匀的分布在画布上,并且尽可能的减少边的交叉(如果交叉过多,就很难看清楚顶点之间的关系了)。所以使用graphviz的一般流程为:
- 定义一个图,并向图中添加需要的顶点和边
- 为顶点和边添加样式
- 使用布局引擎进行绘制
安装运行
以Windows为例,从官网上下载安装包 graphviz-2.38.msi,https://graphviz.gitlab.io/_pages/Download/Download_windows.html
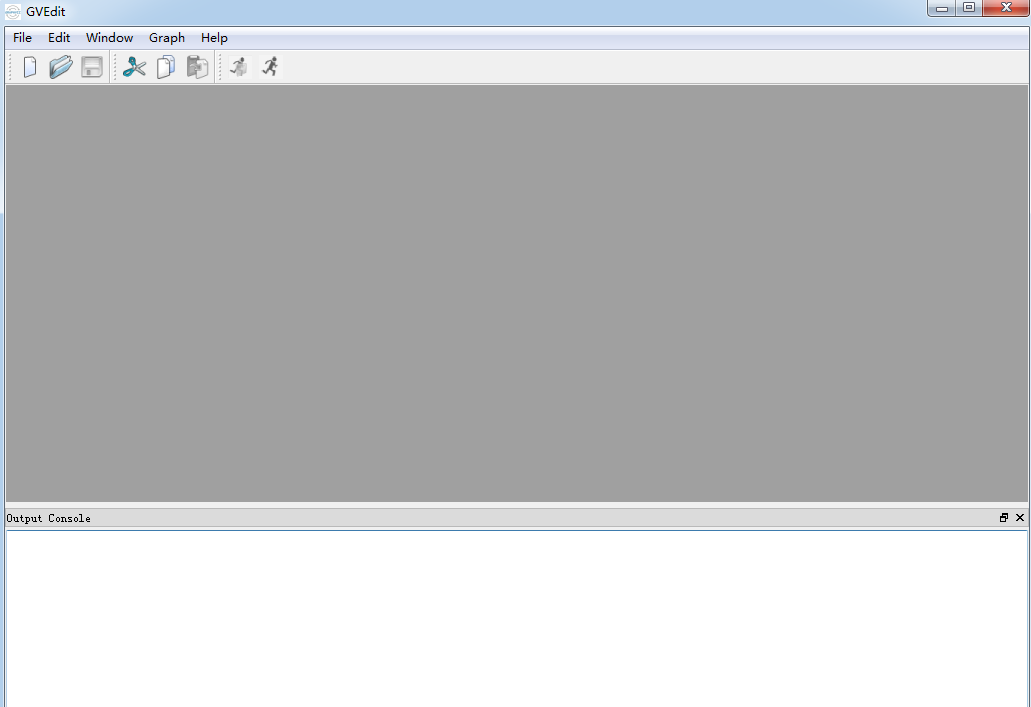
安装完后,在开始菜单里面,开始->所有程序->Grapgviz 2.38->gvedit.exe。打开后如图:
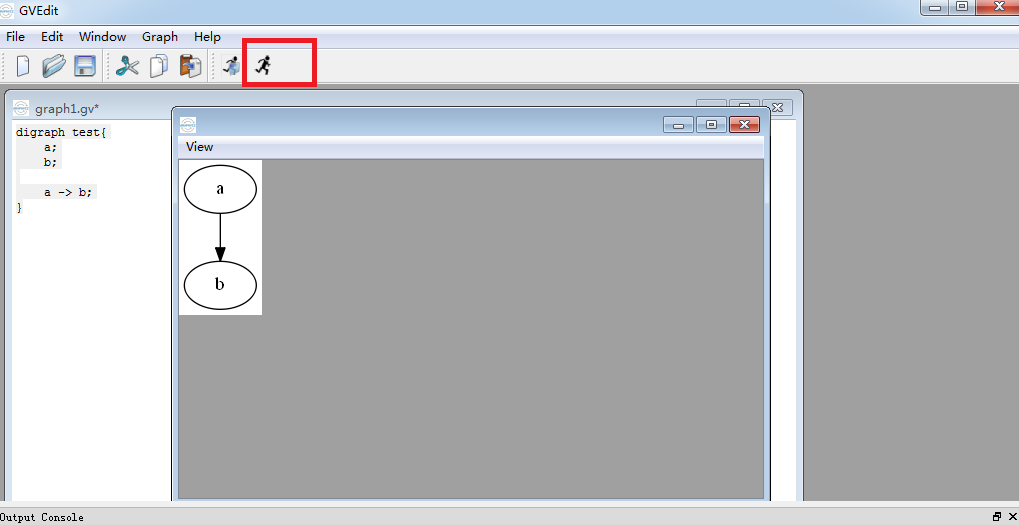
点击新建文件,输入如下代码:
1 | digraph test{ |
运行程序,点击下图中用红色标注的按钮,可以看到如下运行效果:
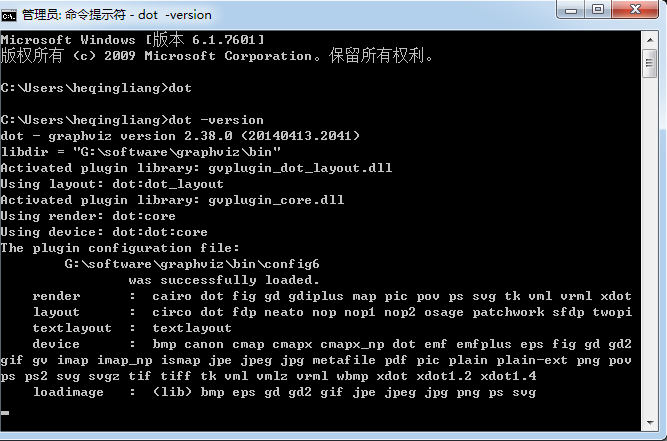
如果想在命令运行或其他的编辑器中运行dot脚本,需要把graphviz安装后的bin目录添加到环境变量中,添加完后,打开命令行,输入以下命令,验证是否安装成功:
图
有向图和无向图
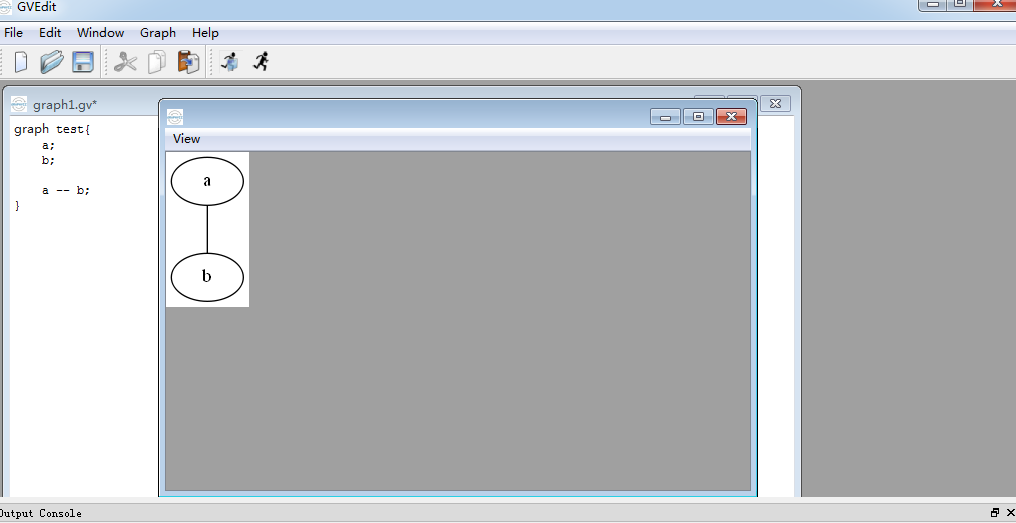
使用graph定义无向图,使用digraph定义有向图,如上面的使用的test使用的是有向图,无向图和有向图最大的区别就是,有向图使用的连接线是->, 而无向图使用的是--。把上面的test改成无向图:
1 | graph test{ |
运行如下图:
图的属性
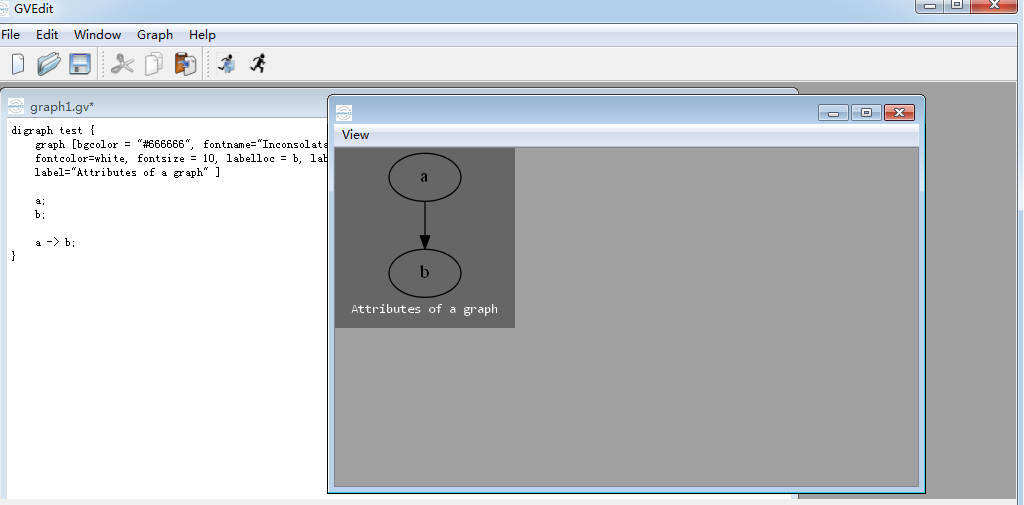
图的属性设置方式有两种,其一是直接在{}内列出,如:size = ”4, 4”;另一种方式使用:graph [属性列表],如下代码,为上面的test添加图的属性:
1 | digraph test { |
在graph [属性列表] 添加属性,效果和上面是一样的:
1 | digraph test { |
运行效果,如下图:
更多的属性设置,可以参考官方的文档https://graphviz.gitlab.io/_pages/doc/info/attrs.html。
节点和连接线
节点和连接线的属性
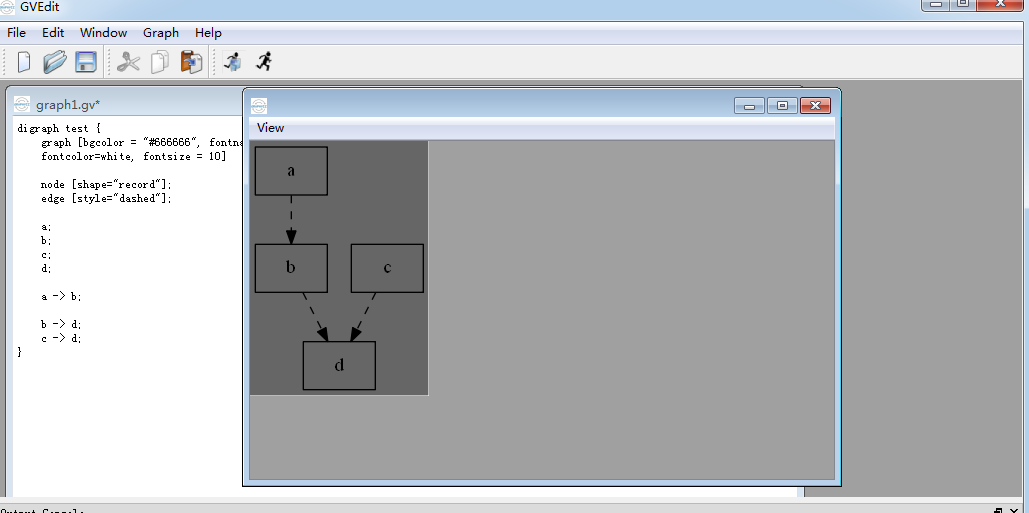
节点和连接线的属性和图的属性设置是差不多的,用node的列表可以设置节点的属性,edge设置连接线的属性。如下代码,把节点设置为矩形,连接线为虚线:
1 |
|
运行效果,如下图:
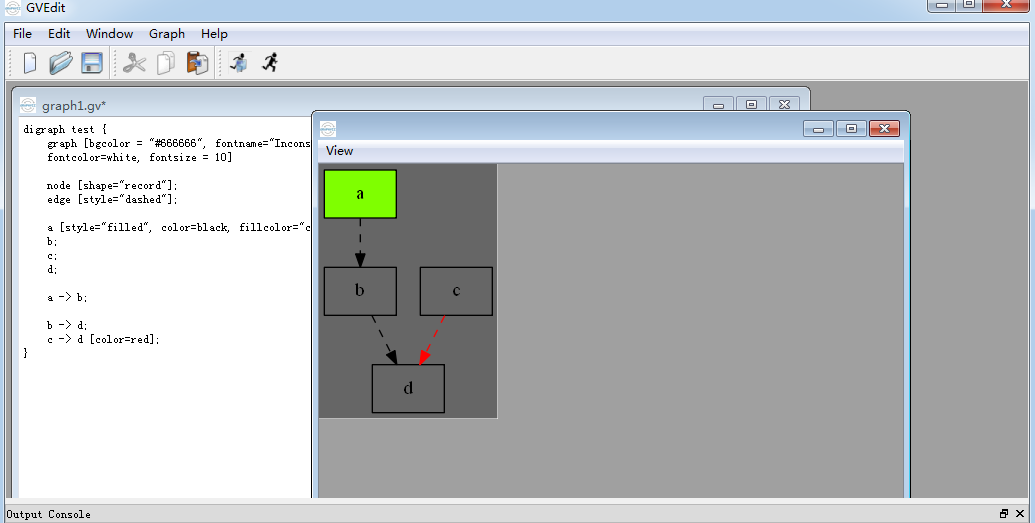
用node和edge设置的属性是全局的,会影响所有的节点,如果想给只给某几个节点或某条连接线设置属性,可以只设置某个节点和连接线的属性列表,如下代码,设置a节点的颜色为淡绿色,并将c到d的边改为红色:
1 | digraph test { |
运行效果,如下图:
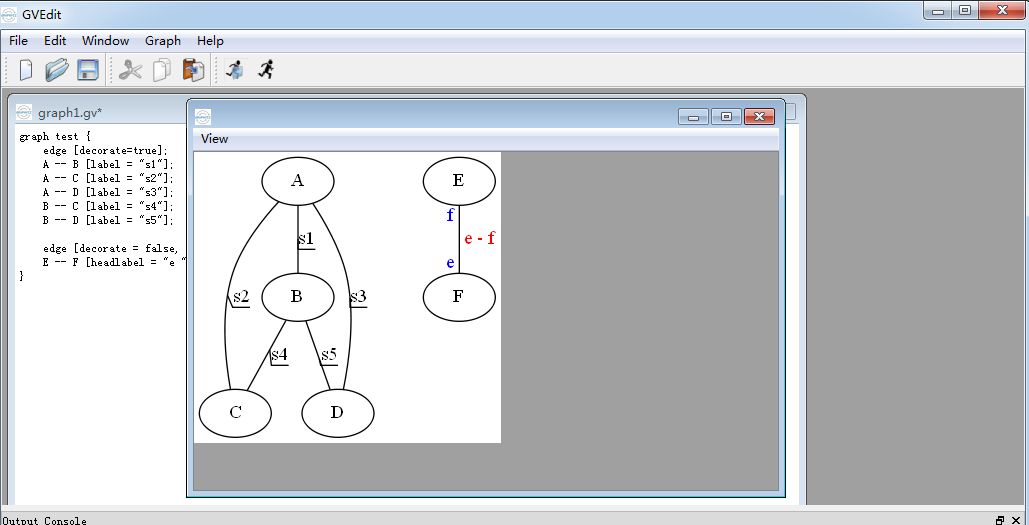
当线和线label 比较多时,可以给线的属性decorat=true,使得每条线的label标识其所属的连接线。
还可以给每条线加上headlabel和taillabel,给每条线的起始点和终点加上label,他们的颜色由labelfontcolor 来决定,而label的颜色由fontcolor来决定。
如下代码:
1 | graph test { |
运行效果,如下图:
以图片为节点
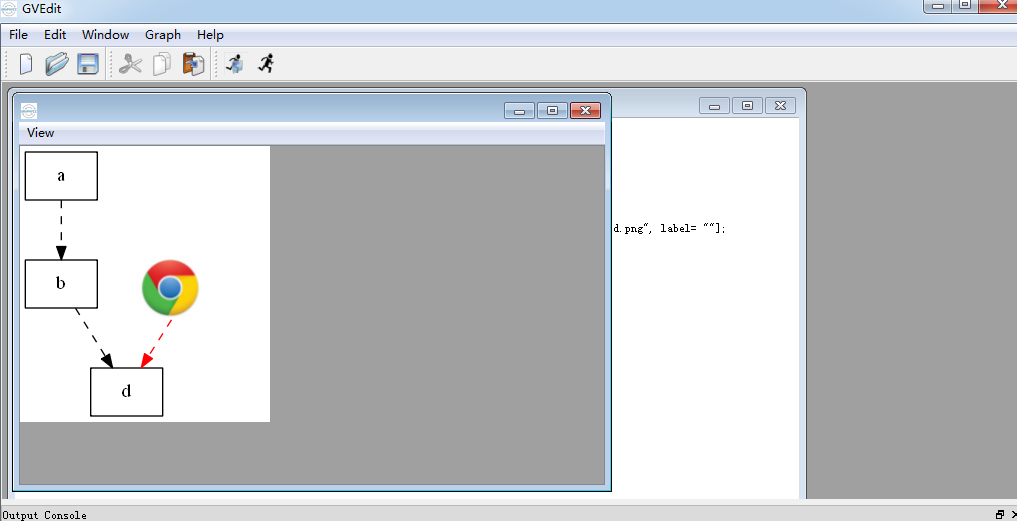
除了颜色,节点还可以使用图片。不过需要注意的是,在使用图片作为节点的时候,需要将本来的形状设置为none,并且将label置为空字符串,避免出现文字对图片的干扰:
digraph test {
    node [shape="record"];
    edge [style="dashed"];

    a [style="filled", color="black", fillcolor="chartreuse"];
    b;
    c [shape="none", image="logos/browser-icon-chrome-resized.png", label=""];
    d;

    a -> b;
    b -> d;
    c -> d [color="red"];
}
运行效果,如下图:
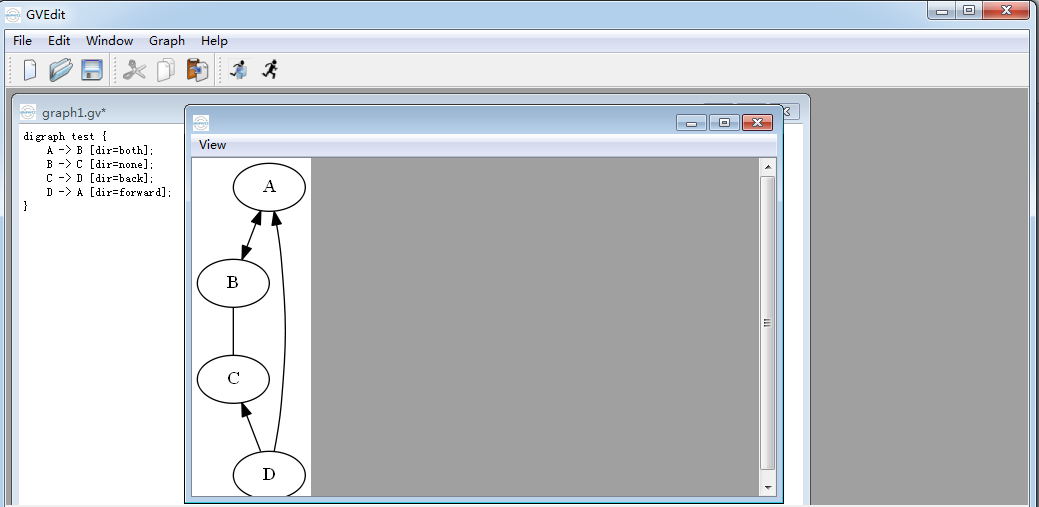
箭头的方向
用dir属性可以设置每条边箭头的方向,有forward(默认)、back、both、none 四种。如下代码:
1 | digraph test { |
运行效果,如下图:
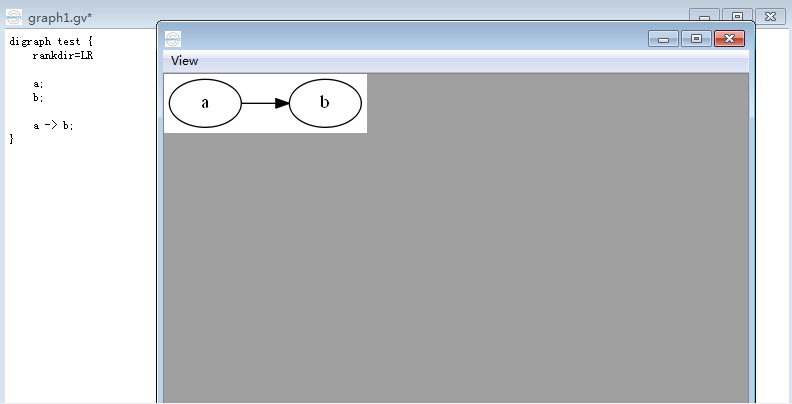
线的位置
默认时图中的线都是从上到下的,我们可以将其改为从左到右,在文件的最上层打入rankdir=LR 就是从左到右,默认是TB(top -> bottom),也可以是RL,BT。
如下代码,则把线的设置为从左至右:
1 | digraph test { |
运行效果,如下图:
如果需要点能排在一行(列),这时要用到rank,用花括号把rank=same,然后把需要并排的点一次输入。
如下代码,a和e排成一列、c和d排成一列:
1 | digraph test { |
运行效果,如下图:
![]()
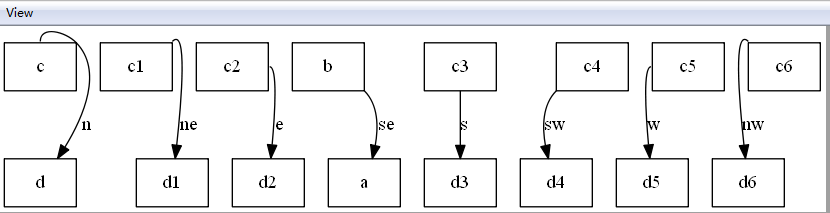
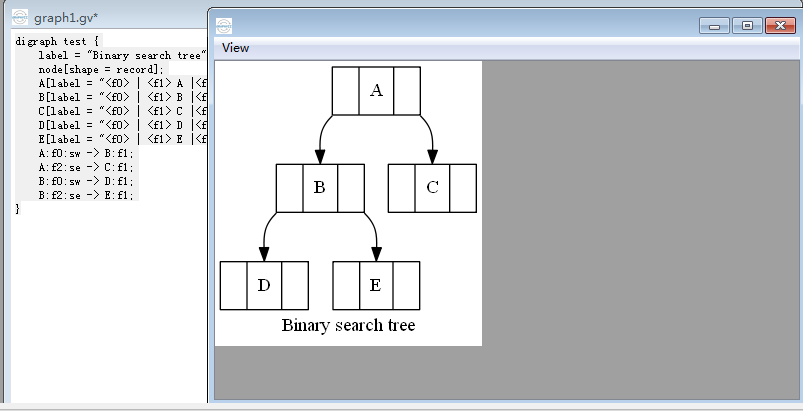
设立一条边时,可以制定这条边从起点的那个位置射出和从哪个位置结束。遵守:上北下南,左西右东的原则,分别使用方位n(North), s(South), w(West), e(East)来定义,一共有8个连接点:{n, ne, e, se, s, sw, w, nw},如下代码:
1 | digraph test { |
运行效果,如下图:
如下代码,绘制一颗二叉树:
1 | digraph test { |
运行效果,如下图:
表格
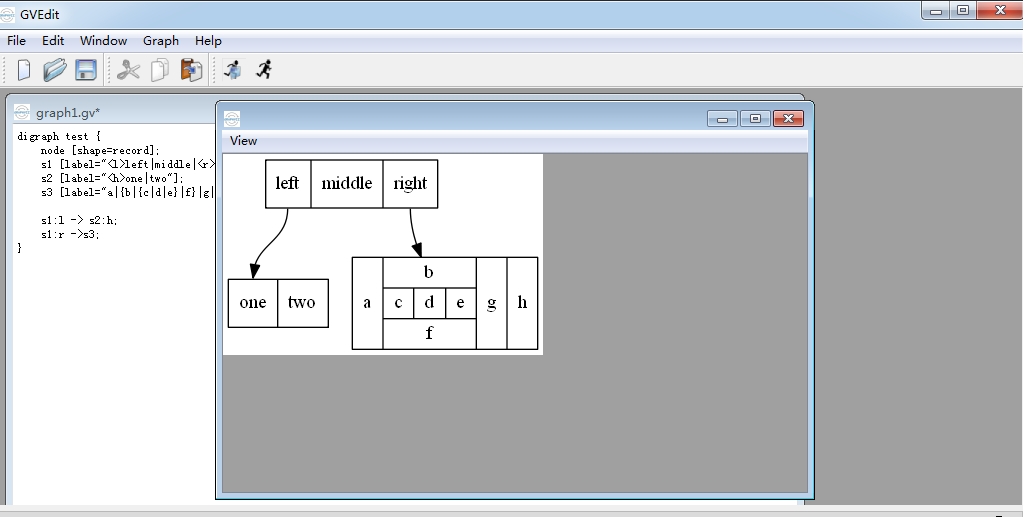
gaphviz的表格也是一种节点类型,使用label标签来指定内容和格式
内置布局方式通过shape为record(矩形框) & Mrecord(圆角矩形框)来指定,如果和当前方向一致使用|来隔开,使用{|}表示和当前方向相反,比如说默认是纵向布局方式,那|隔开的也是从上到下,{|}则是从左到右,只是要注意,如果是在一个{|}内部再{|},又变成了从上到下(如果只是文字换行,可以在文字末尾加\n(居中对齐)\l(左对齐)\r(右对齐)进行切分)
内置布局最大的问题是不能分别调整每个格子里的颜色和字体,所以如果需要更丰富的控制可以通过使用HTML表格标签,这种方式不要求shape为record或Mrecord样式,另外需要注意的是使用<>而不是双引号来引用内容
如下代码:
1 | digraph test { |
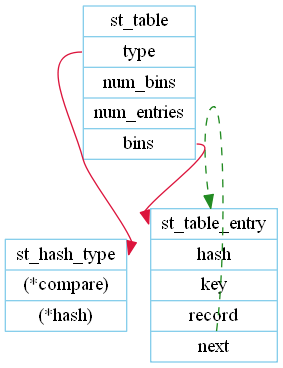
绘制hash表的数据结构
如下面的代码是一个C语言的struct结构:
1 | struct st_hash_type { |
用dot脚本描述,代码如下:
1 | digraph test { |
运行效果,如下图:
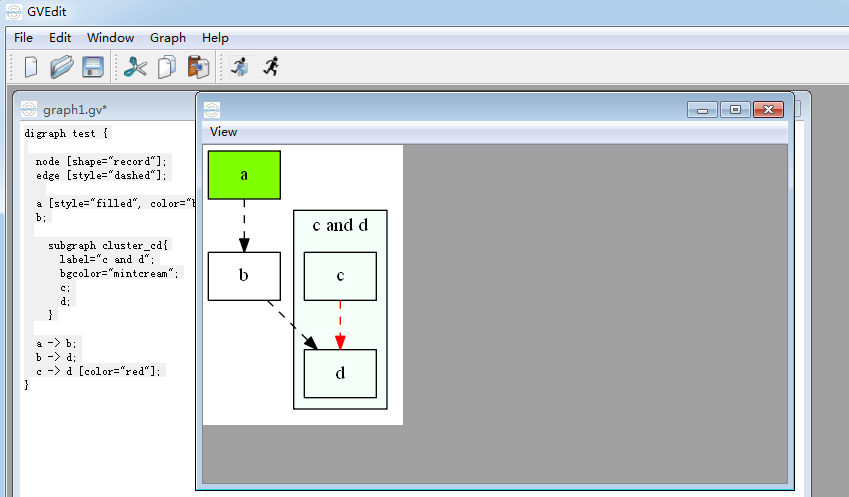
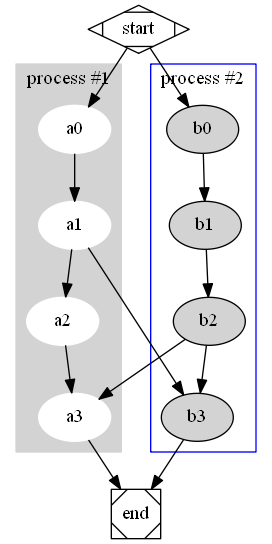
子图
graphviz支持子图,即图中的部分节点和边相对对立,子图使用subgraph定义,必须以cluster开头命名,比如,下面的代码将顶点c和d归为一个子图:
1 | digraph test { |
运行效果,如下图:
如下代码:
1 | digraph test { |
shape=Mdiamond设置的图形的形状,关于更多的图形可以参考http://www.graphviz.org/doc/info/shapes.html,运行效果,如下图:
其他
更多的图形的绘制可以参考官方的文档。